Tools for importing, analyzing and visualizing ego-centered or personal network data. egor integrates nicely with the tidyverse, by providing methods for most dplyr commands. An egor object contains the three data levels, ego, alter and alter-alter ties (aatie). In order to switch between the three data levels the activate() concept is lent from the tidygraph package.
Visualize
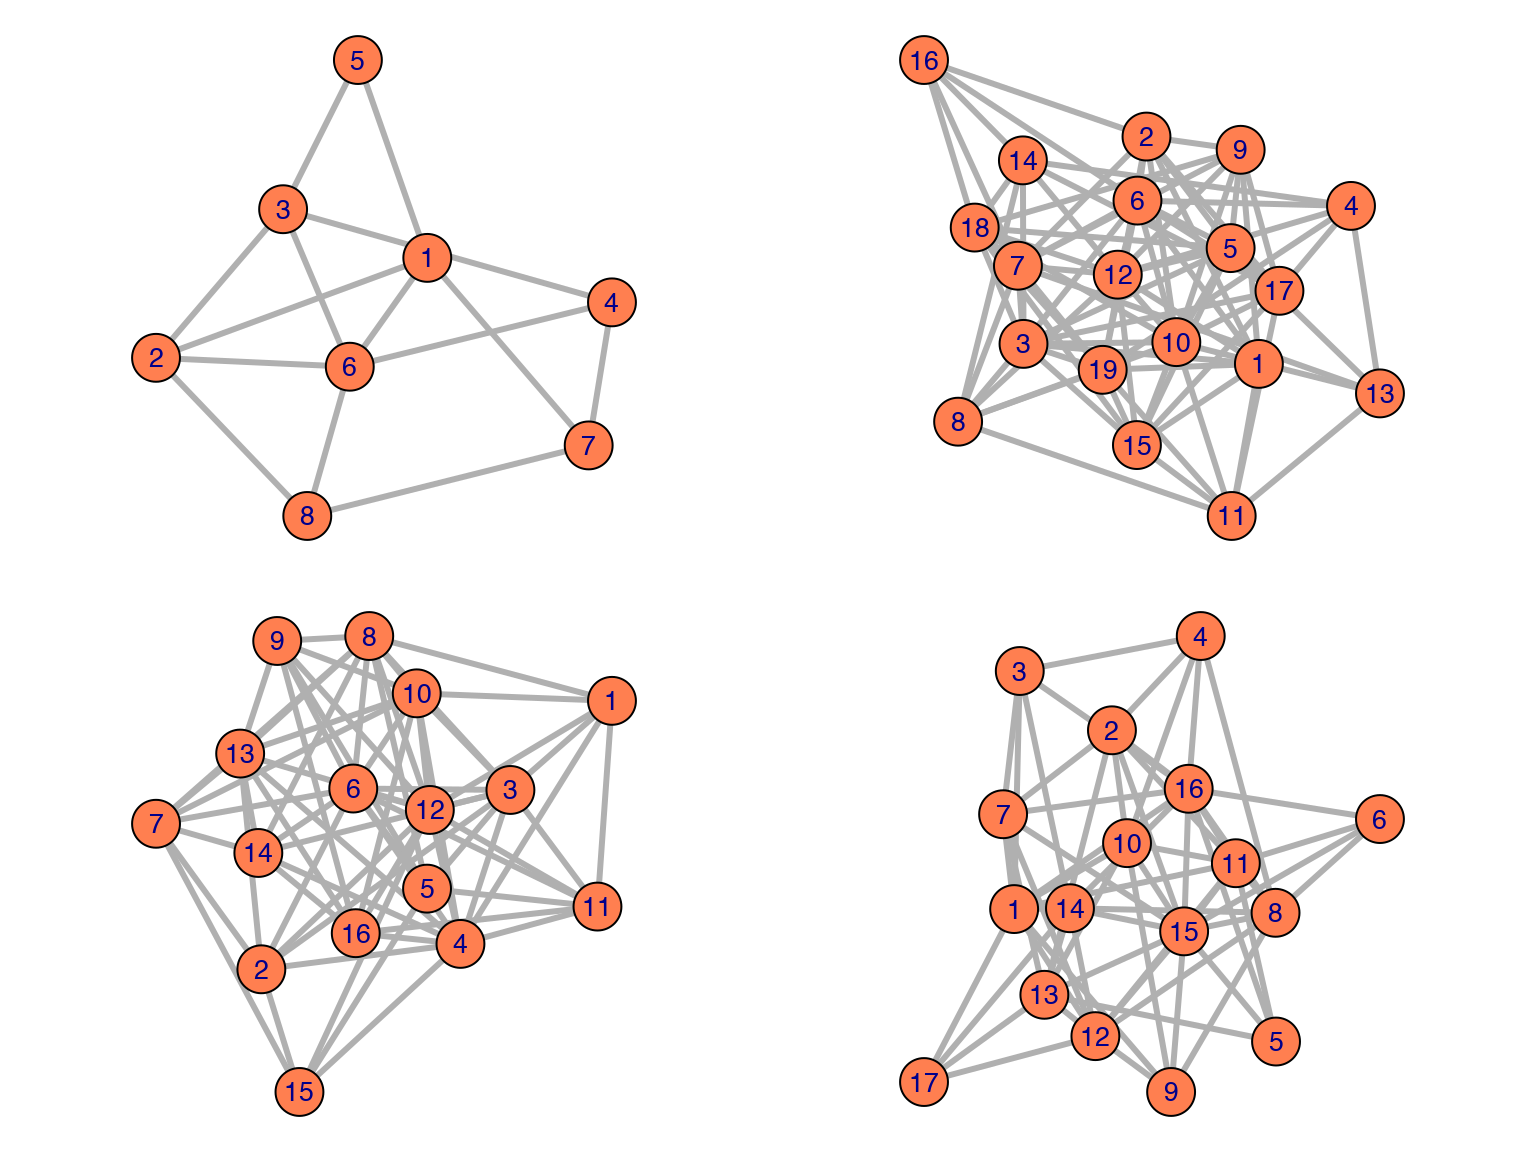
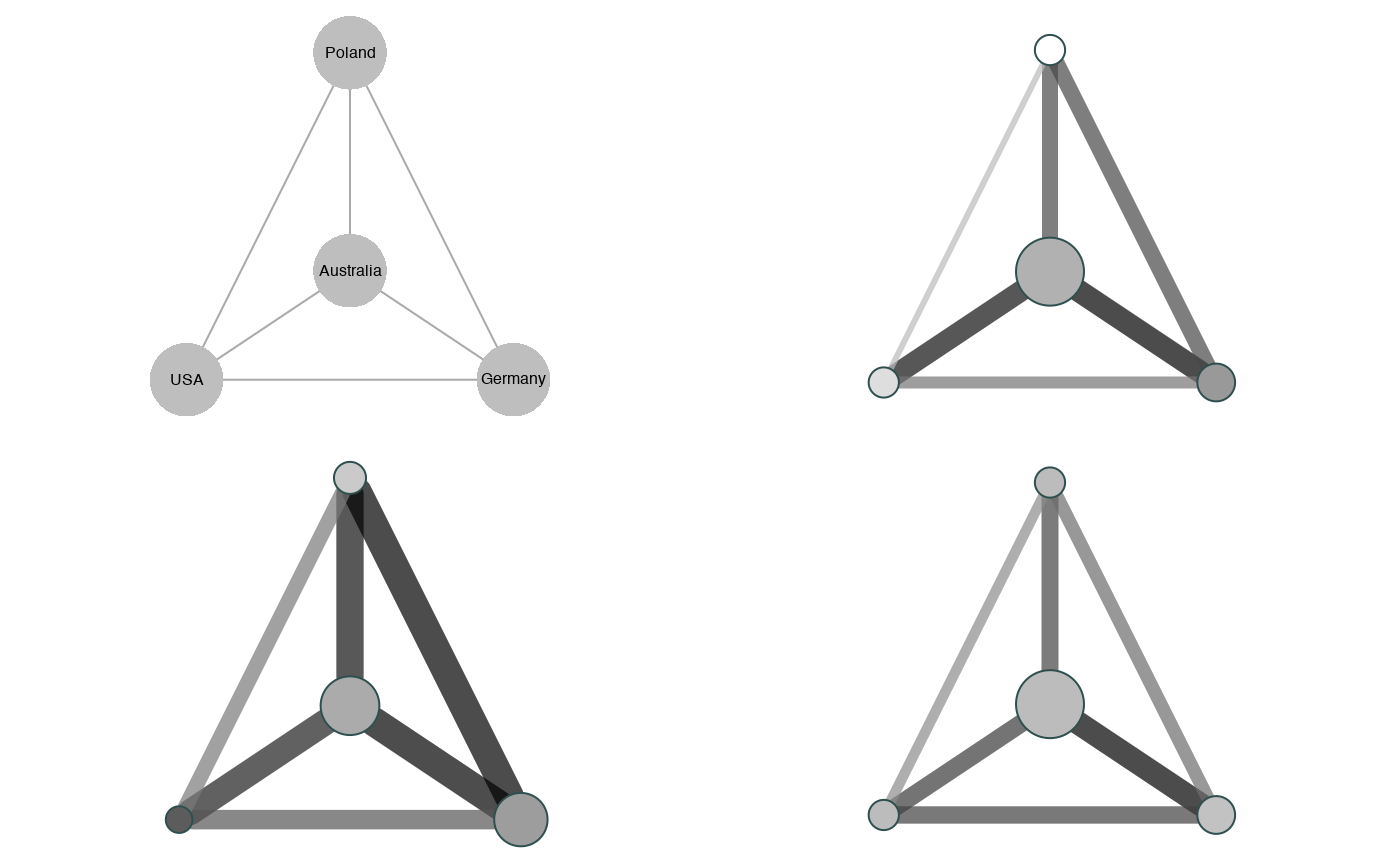
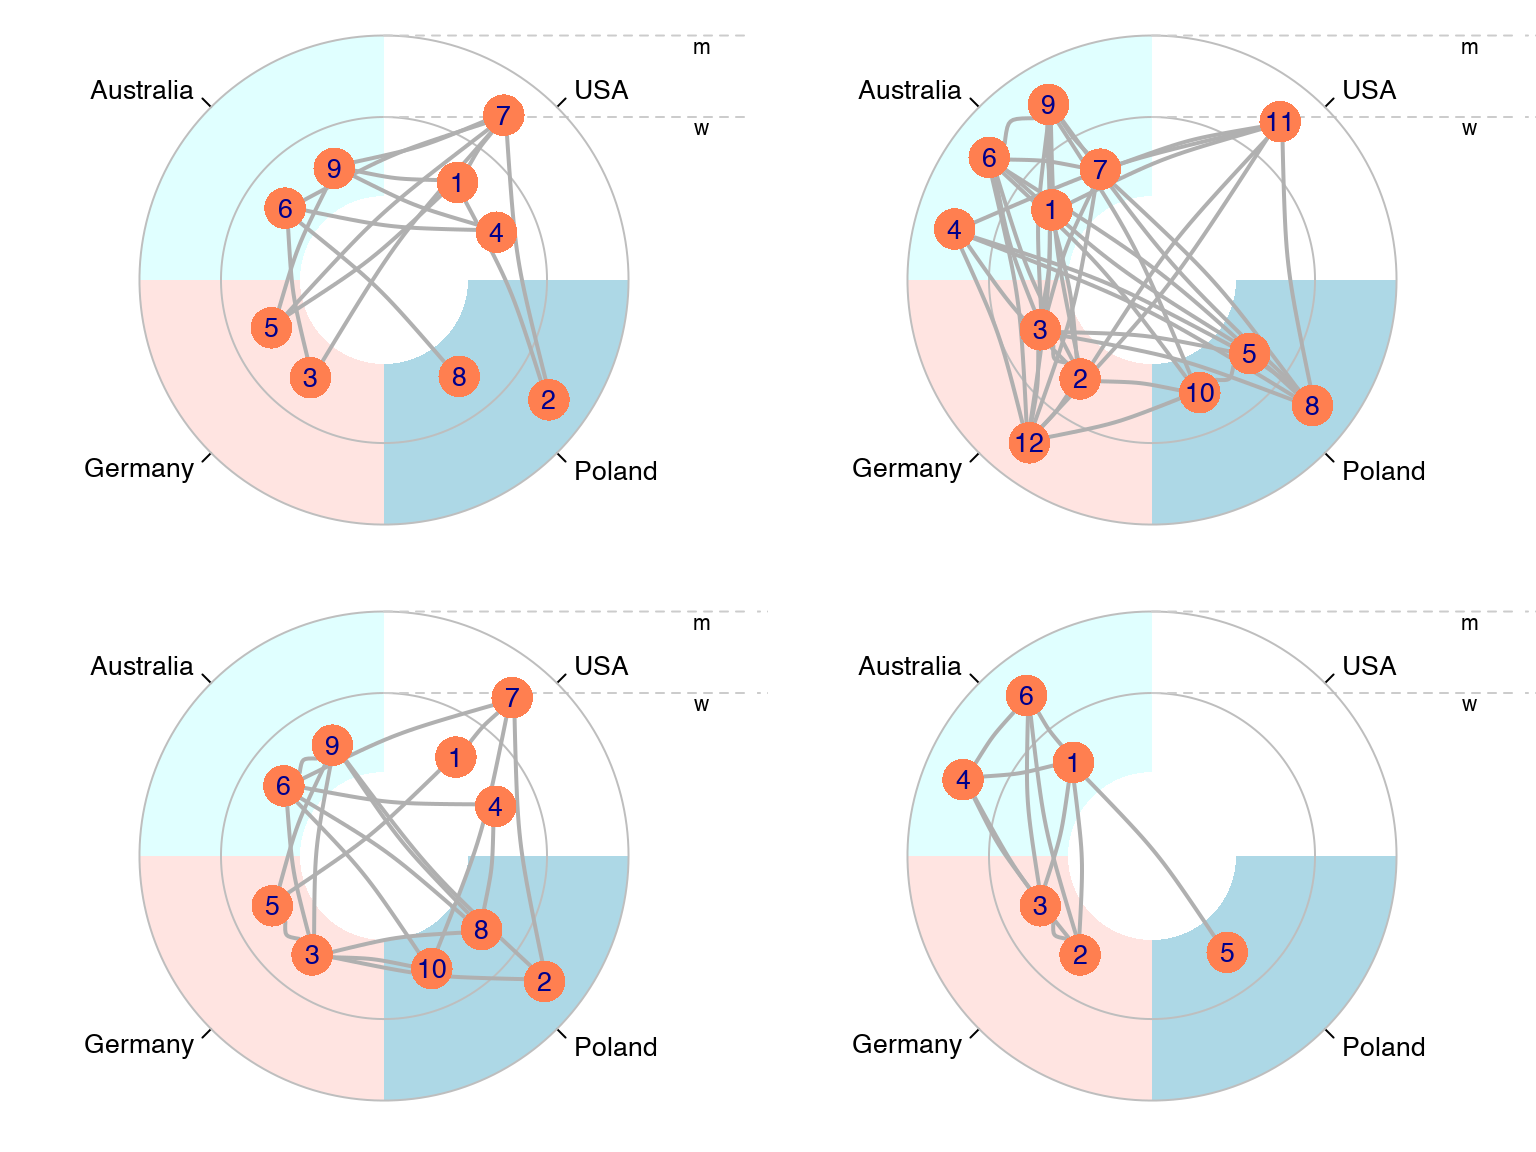
egor offers a few visualization techniques for ego-centered network data:
- regular network plots

- clustered graphs

- ego-grams

And there is a Network Visualization App providing a graphical interface that let’s the user compose their visualizations interactively.

Import data
An egor object can be created with the egor() command. In addition there are some functions that import specific data formats for ego-centered network data.
There are currently three importing functions that read the data exported from data collection tools from the hard drive and load them as an egor object.
read_openeddi()
read_egoweb()
read_egonet()
In addition there are three functions that help with the transformation of common data formats of ego-centered network data into egor objects:
onefile_to_egor()
twofiles_to_egor()
threefiles_to_egor()
Analyse
There are a few commands facilitating the analysis of ego-centered networks. To learn more, please take a look at the package vignette.