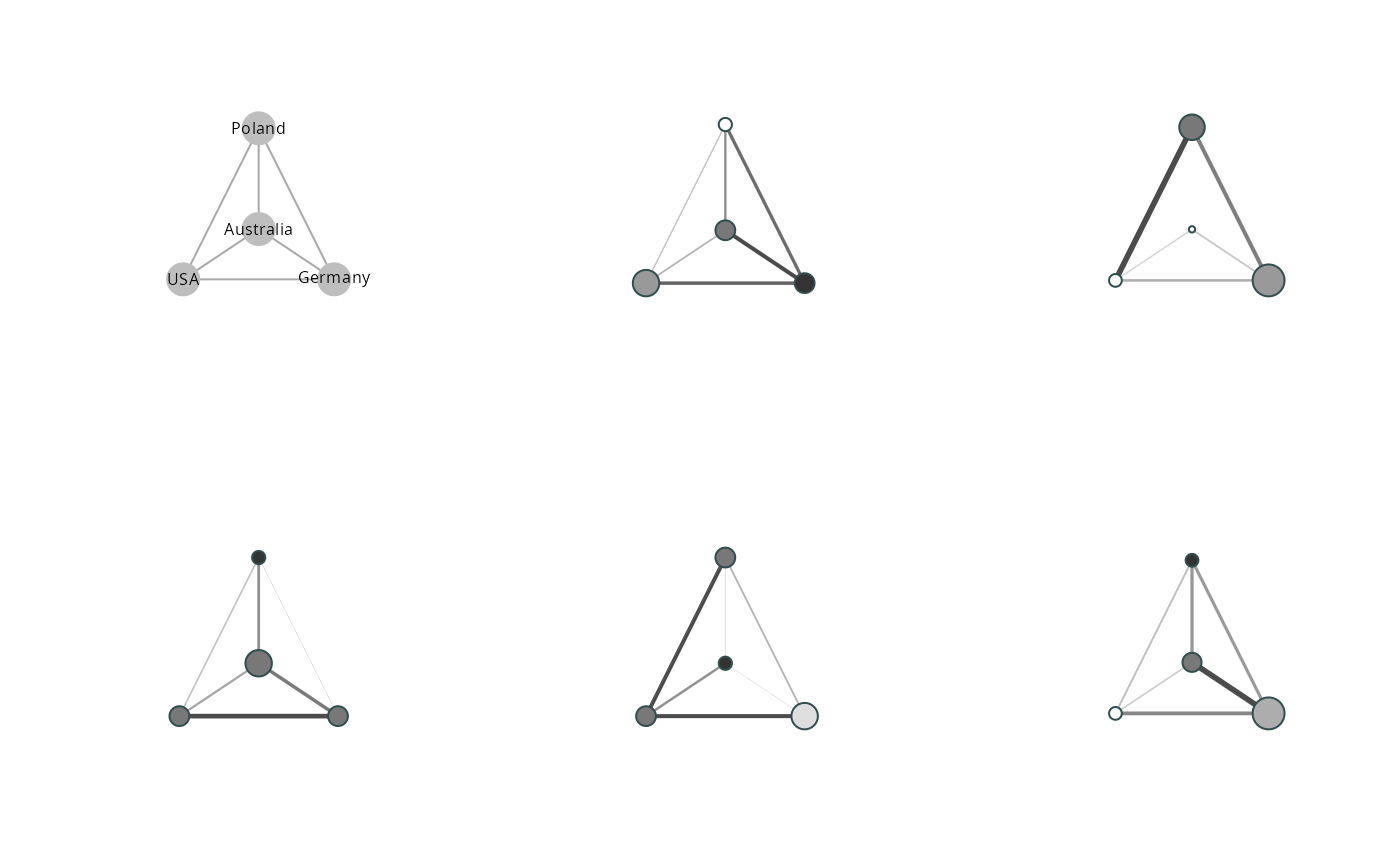
The idea of clustered graphs is to reduce the complexity of an ego-centered network
graph by visualizing alters in clusters defined by a categorical variable (Lerner et al. 2008).
clustered_graphs() calculates group sizes, inter and intra group tie
densities and returns these informations in a list of igraph objects.
Usage
clustered_graphs(object, ..., clust.groups)

# S3 method for class 'list'
clustered_graphs(object, aaties, clust.groups, ...)

# S3 method for class 'egor'
clustered_graphs(object, clust.groups, ...)

# S3 method for class 'data.frame'
clustered_graphs(object, aaties, clust.groups, egoID = ".egoID", ...)
Arguments
- object
An
egorobject.- ...
arguments to be passed to methods
- clust.groups
A
characternaming thefactorvariable defining the groups.- aaties
data.frame/ listcontaining alter-alter relations as a 'global edge list' or as a list of 'edge lists'. (not needed ifobjectis anegorobject).- egoID
Character. Name of the variable identifying egos (default: "egoID").
Value
clustered_graphs returns a list of graph objects representing
the clustered ego-centered network data;
References
Brandes, U., Lerner, J., Lubbers, M. J., McCarty, C., & Molina, J. L. (2008). Visual Statistics for Collections of Clustered Graphs. 2008 IEEE Pacific Visualization Symposium, 47-54.
See also
vis_clustered_graphs for visualizing clustered graphs