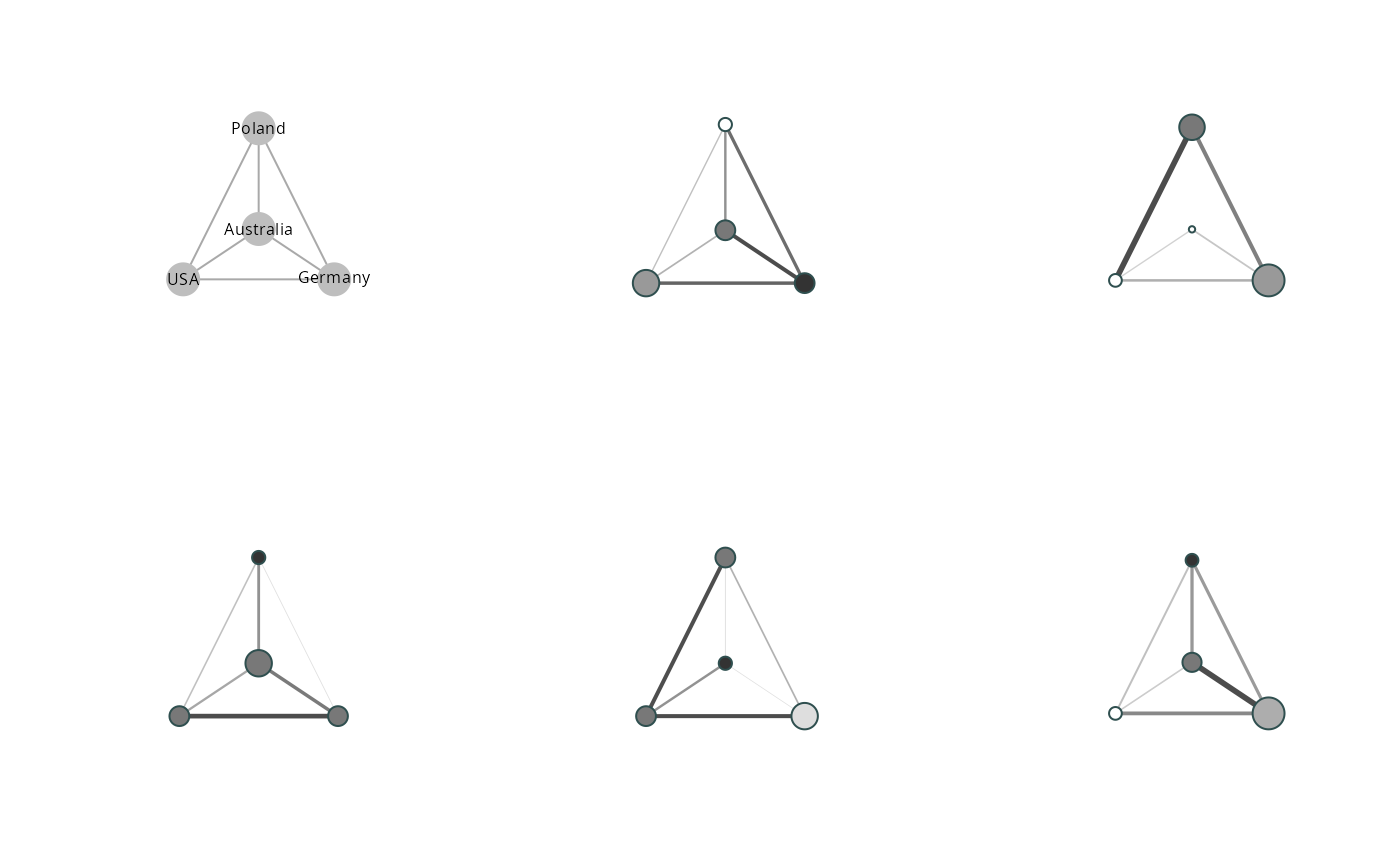
vis_clustered_graphs visualizes clustered_graphs using a list of
clustered graphs created with clustered_graphs.
Usage
vis_clustered_graphs(
  graphs,
  node.size.multiplier = 1,
  node.min.size = 0,
  node.max.size = 200,
  normalise.node.sizes = TRUE,
  edge.width.multiplier = 1,
  center = 1,
  label.size = 0.8,
  labels = FALSE,
  legend.node.size = 45,
  pdf.name = NULL,
  ...
)
Arguments
- graphs
Listofgraphobjects, representing the clustered graphs.- node.size.multiplier
Numericused to multiply the node diameter of visualized nodes.- node.min.size
Numericindicating minimum size of plotted nodes- node.max.size
Numericindicating maximum size of plotted nodes- normalise.node.sizes
Logical.If TRUE (default) node sizes are plotted using per network proportions rather than counts.- edge.width.multiplier
Numericused to multiply the edge width.- center
Numericindicating the vertex to be plotted in center.- label.size
Numeric.- labels
Boolean. Plots with turned off labels will be accompanied by a 'legend' plot giving the labels of the vertices.- legend.node.size
Numericused as node diameter of legend graph.- pdf.name
Charactergiving the name/path of the pdf file to create.- ...
Arguments to pass to
plot.igraph.
Value
vis_clustered_graphs plots
a list of igraph objects created by the clustered_graphs
function.
clustered_graphs returns a list of graph objects representing
the clustered ego-centered network data;
References
Brandes, U., Lerner, J., Lubbers, M. J., McCarty, C., & Molina, J. L. (2008). Visual Statistics for Collections of Clustered Graphs. 2008 IEEE Pacific Visualization Symposium, 47-54.
See also
clustered_graphs for creating clustered graphs objects